


If you like trading or investing in alternative cryptocurrencies, keeping track of your holdings can be an headache. Fortunately, you can always use our portfolio tracking app which is sure to make your life much easier! This tool went from a simple tracking app to a more advanced one with special features and functionalities like the advanced charts.
In this guide, we're going to explain how the Advanced Chart tab works and how you can take advantage of it to analyze your strategy and maximize your profits with the information gained.
Part 6 - Advanced Chart
Step 1: Click on the "Advanced Chart" tab
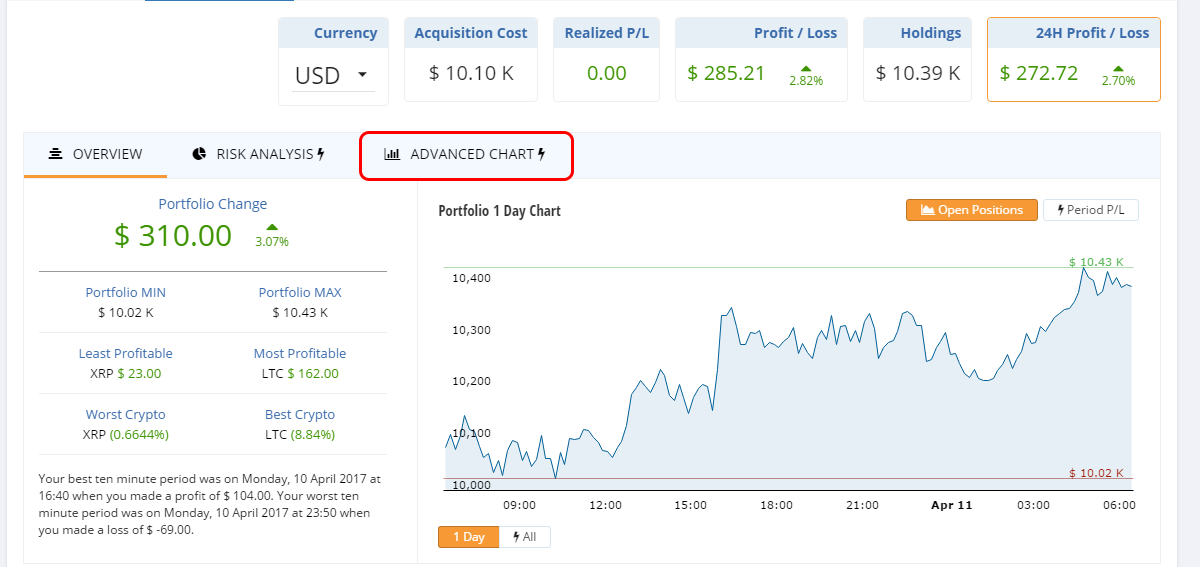
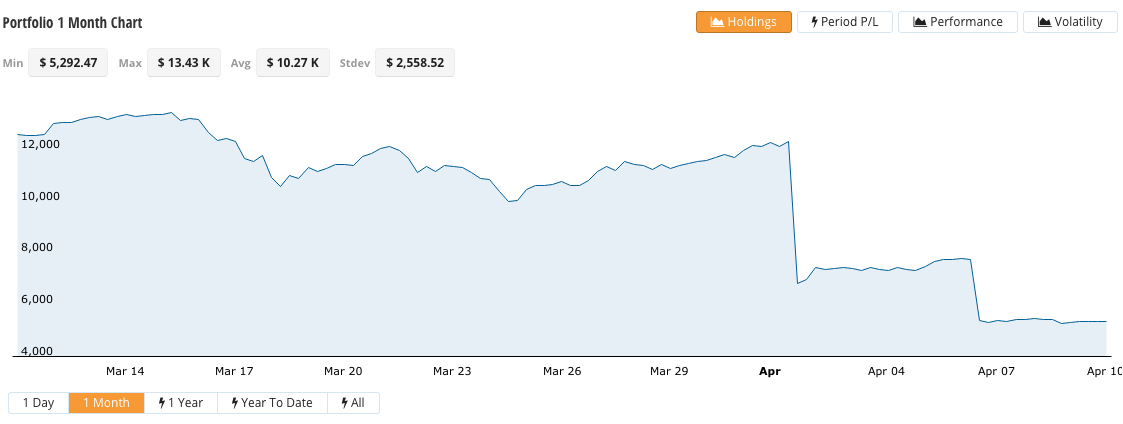
Now, you'll see a bigger chart like the one below:
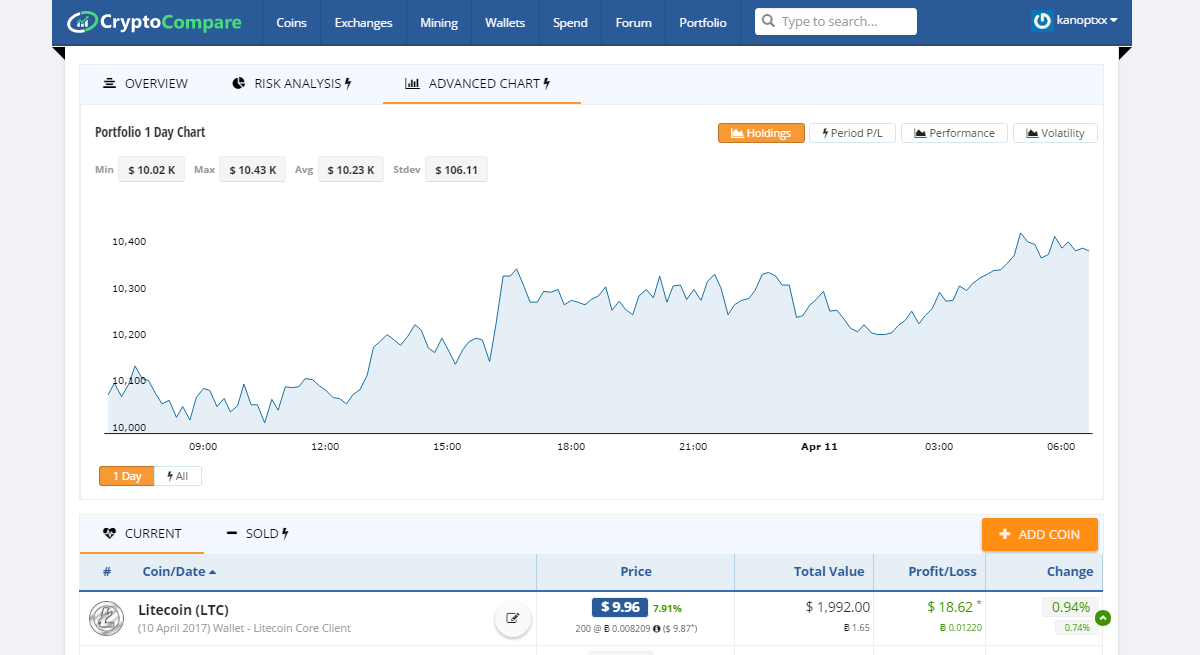
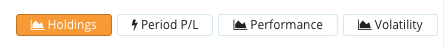
The advanced chart gives you the following visualisations/metrics for your portfolio:
- Holdings
- Period P/L
- Performance
- Volatility
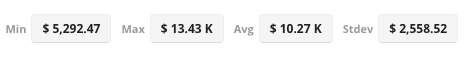
On top of each chart, you have the basic statistics: minimum, maximum, average and standard deviation.
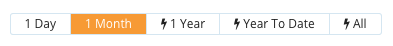
In order to use the Chart, choose the time period you are interested in at the bottom of the chart:
Holdings
The holdings chart shows how the portfolio value has value evolved over time. You will see a big jump on this chart when you buy new coins or sell existing coins.
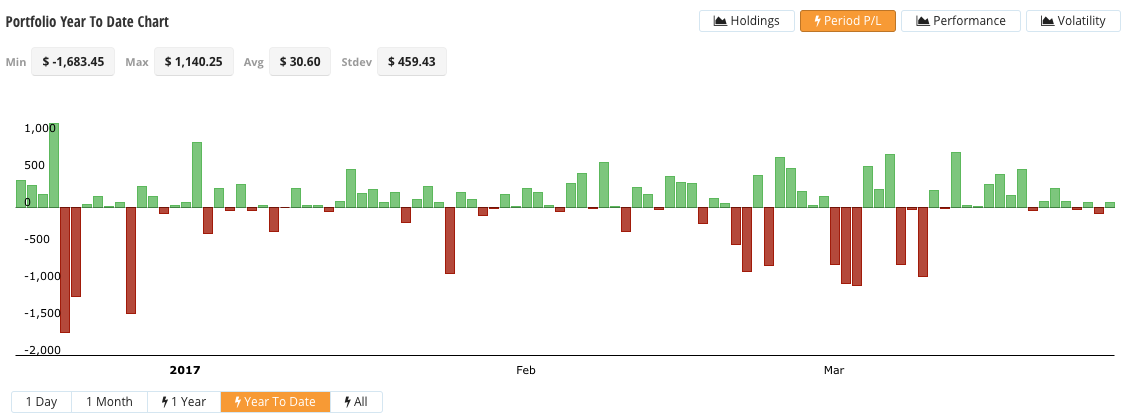
Period P/L
Monitor your profit and loss by this chart so see which were the most profitable periods.
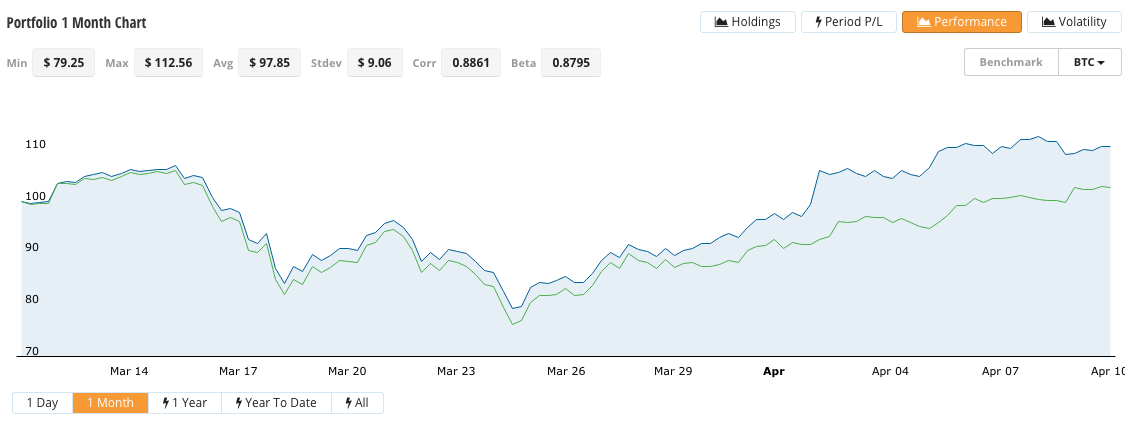
Performance
you can use the performance chart to measure how well your portfolio has done. Performance is measured by rebasing your portfolio to 100 (just like the FTSE was back in 1962) that you have at the beginning of the period and re-adjusts the portfolio when you have taken profits or losses.
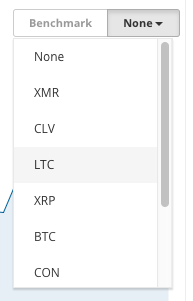
You can even choose a benchmark to compare your portfolio performance with.
Two additional stats: correlation and beta are available for you to better evaluate your trading strategy.
Correlation tells you in a scale of -1 to 1 how your portfolio and benchmark moves together. A correlation of -1 says your portfolio and the benchmark moves completely opposite (one moves up where the other moves down), a correlation of 1 says they completely move together (both move up or both move down).
Beta is also a measure for price covariance, usually used with a market index. It shows that how volatile your portfolio is compared to a benchmark index (or market). Beta is not bounded, a beta value over 1 says your portfolio is more volatile than the market, a beta value less than 1 says your portfolio is less volatile compared to the market. So with a beta of 1 - your portfolio will go up 1% when the market goes up 1% and with a beta of 1.5 will go up more than the market!
You can view your benchmark coin as a market index, as prices are aggregated over multiple exchanges and calculated as a CryptoCompare Index.
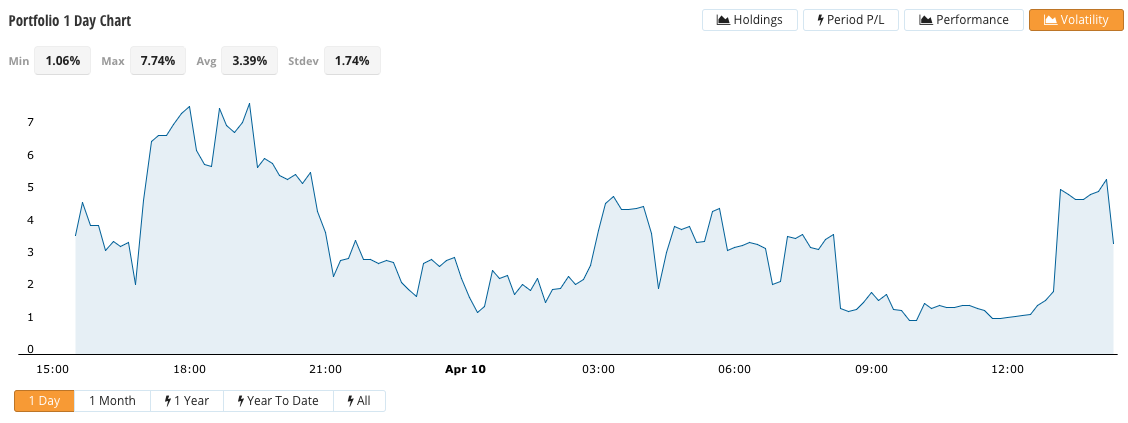
Volatility
Volatility is a metric that shows how stable/unstable your portfolio value is over time. High volatility means big price changes, low volatility means small price changes. A high volatility portfolio is a risky portfolio.
Your portfolio volatility is calculated based on the period you are inspecting, annualized.
Important information
This website is only provided for your general information and is not intended to be relied upon by you in making any investment decisions. You should always combine multiple sources of information and analysis before making an investment and seek independent expert financial advice.
Where we list or describe different products and services, we try to give you the information you need to help you compare them and choose the right product or service for you. We may also have tips and more information to help you compare providers.
Some providers pay us for advertisements or promotions on our website or in emails we may send you. Any commercial agreement we have in place with a provider does not affect how we describe them or their products and services. Sponsored companies are clearly labelled.


 Opera
Opera
 Internet Explorer